 Laminar
Free
Laminar
Free
Laminar is an open source AI agent observability platform for AI agents. It focuses on tracing, evals, AI monitoring, SQL query dashboards, datasets and self-hosted deployment to help teams locate the cause of agent failure and continue iteration.
Laminar
Core parameters and statistics
Laminar is an open source observability platform for AI agents. The official warehouse description positions it as an "open-source observability platform purpose-built for AI agents". It is not a general chatbot, nor is it a simple model training framework, but puts the traces, evals, signals, datasets, SQL queries and dashboards in the agent running link into the same LLMOps workbench.
| Projects | Public Information |
|---|---|
| Official positioning | Open-source observability platform purpose-built for AI agents |
| Core Competencies | Tracing, Evals, AI monitoring, SQL access, Dashboards, Datasets, Annotation |
| Technical roadmap | OpenTelemetry-native tracing SDK, Rust backend components, custom realtime engine, gRPC exporter |
| Integrated objects | Vercel AI SDK, Browser Use, Stagehand, LangChain, OpenAI, Anthropic, Gemini, etc. |
| Deployment path | Managed platform, self-hosted Docker Compose, production bounded full compose |
| Open Source License | Apache-2.0 |
| GitHub Community | About 3,026 stars, 210 forks, 86 open issues |
| Latest public version | v0.2.0, released on 2026-06-18 |
Positioning Boundary: Laminar's advantage lies in agent link observation and evaluation, and it is not a direct replacement for LLM, vector database or business orchestration framework. If the team only has one-time prompt debugging needs, using it will be too important; if the agent has entered the multi-tool, multi-model, and multi-step execution stage, its trace and eval perspectives will be more valuable.
User and market recognition
Laminar's market signals mainly come from the open source community YC endorsement and developer ecosystem, rather than the number of publicly disclosed corporate customers. The official warehouse shows that the project belongs to YC S24, and the warehouse description README and public screenshots are all centered around agent failure diagnosis and iteration efficiency, indicating that its target users are not the general office crowd, but R&D teams that are putting AI agents into production or quasi-production.
Open Source Popularity: GitHub API shows that the lmnr warehouse has about 3,026 stars and 210 forks, and has formed observable developer attention. This scale does not equate to commercial adoption, but is sufficient to illustrate its continued external validation in LLM observability and agent evals scenarios.
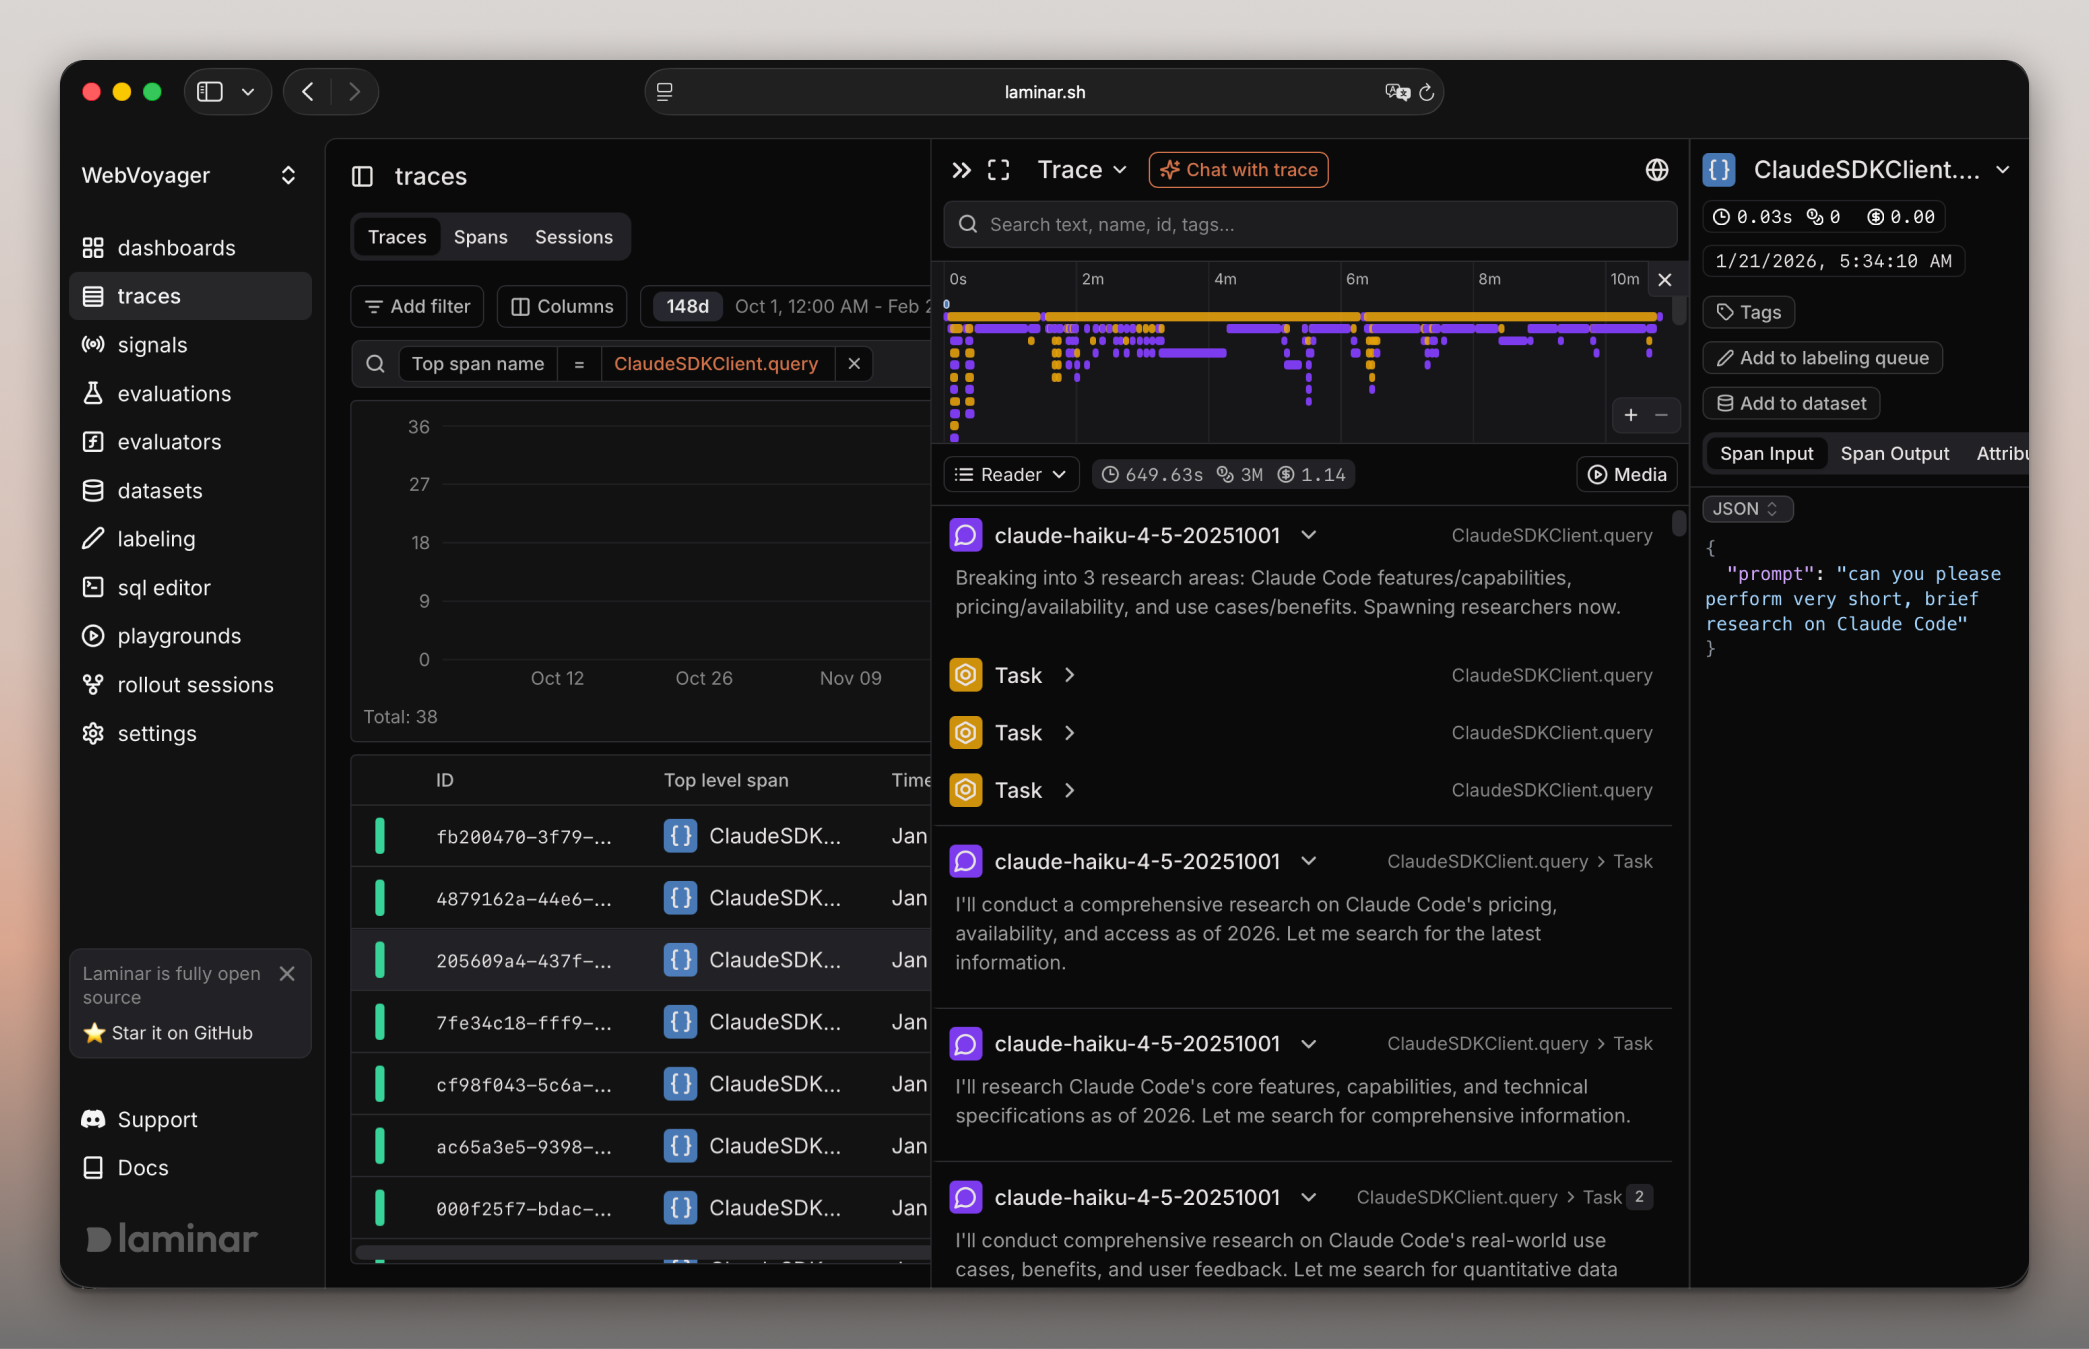
Product Signals: The official README lists traces, evaluations, signals, datasets, SQL editor, and dashboards as core capabilities. Navigation items such as traces, signals, evaluations, datasets, labeling, sql editor, and playgrounds can also be seen in the product screenshots. This information architecture shows Laminar's attempt to cover the entire spectrum from run logging to data set precipitation, from problem detection to evaluating regressions.
Uncertain items: The official number of cumulative users, number of paying customers, or revenue scale has not been disclosed, so these dimensions should remain undisclosed. When purchasing or technology selection, it is more suitable to use the self-hosted runnability SDK coverage trace query performance and eval regression process as the basis for verification.
Cost advantage
- C-side/Individual: Usually a free version is provided to experience the core functions, and high-frequency use requires a paid package subscription.
- API/Developer: Billed by call volume, suitable for development teams that can be flexibly integrated into their own systems.
- Enterprise/Privatized: Contact the business owner for customized quotation and deployment plan. The specific price is subject to the official real-time pricing page.
Main functions
The function of Laminar is organized around "discovering why the agent failed and turning the repair into a regressible process". The core is not a single point of monitoring, but the linkage of trace, eval, dataset and signal.
- Tracing: Collect agent execution links through OpenTelemetry-native SDK. The official README mentions that one line of code can automatically track integrations such as Vercel AI SDK, Browser Use, Stagehand, LangChain, OpenAI, Anthropic, Gemini, etc. Suitable for troubleshooting tool calls, model responses, span times and abnormal locations in multi-step agents.
- Evals: Provides an extensible SDK and CLI to run evaluations locally or in CI/CD, with a UI to visualize eval results and compare changes. It is suitable for converting one-time manual judgment into version return access control.
- AI monitoring / Signals: Allows describing events in natural language and tracking agent problems, logic errors and custom behaviors. Its value lies in upgrading "looking at logs" to continuous detection of business semantic issues.
- SQL access: The built-in SQL editor can query traces, metrics, events, and batch create datasets from queries, which can also be used through the API. Ideal for analyzing large amounts of span data and sedimentation assessment samples.
- Dashboards and datasets: dashboard builder can build dashboards based on traces, metrics, events and SQL; datasets and annotation UI serve eval data production.
The three most important things to verify during implementation are: whether the SDK covers the existing agent technology stack, whether the trace data is sufficient to explain the cause of the failure, and whether the eval data set can be continuously maintained by the team. Without these three points, the platform tends to stay at the dashboard level that “looks complete”.
Model and version evolution
Laminar itself is not a large model, so "version evolution" mainly depends on open source warehouse release, SDK integration and product module iteration. GitHub Releases shows that the latest public version is v0.2.0, released on 2026-06-18; the same release changelog involves a large number of engineering updates such as traces chat, debugger, SQL, self-hosted, Better Auth, Slack OAuth broker, OTEL self-tracing, etc.
Mainline version
- v0.2.0 (2026-06-18): latest public release. The changes cover traces chat OSS, debugger rework, LLM streaming, self-hosted Slack OAuth broker, Better Auth migration SQL endpoint restrictions OTEL self-tracing, configurable Postgres schema, etc., indicating that the project has expanded from basic tracing to debugging, deployment management, and self-hosted enterprise scenarios.
- v0.1.46 (2026-06-18): A direct comparison baseline in the v0.2.0 changelog, suitable as a migration observation point from 0.1.x to 0.2.x.
- v0.1.45 (~2026-06): A historical node publicized by GitHub tags. There is no official official release date yet. It is mainly used to observe the continuity of the 0.1.x series versions.
Version Selection Suggestions: Due to production circumstances, it is not advisable to only follow the latest tag. A more reliable way is to fix the release, use a set of representative agent traces and eval datasets for regression, and confirm that the SDK, database schema, query performance, and permission configuration are all stable before upgrading.
Technical advantages
Laminar's technical advantage comes from the combination of "agent-specific observation model + self-hosted engineering stack + data queryability", rather than the capability of a single model.
OpenTelemetry-native tracing: Mechanically reuses the trace/span thinking in the observation ecosystem, and integrates the agent's model invocation, tool invocation and function execution into a unified link. The effect is that the problem location changes from "reading scattered logs" to "restoring the execution path along the span"; the applicable scenario is multi-model, multi-tool, and multi-step agent.
Rust and real-time engine: The official README mentions using Rust for the backend, a custom realtime engine, ultra-fast full-text search, and a gRPC exporter. The mechanism emphasizes high throughput and real-time viewing. The effect is that it is more suitable for scenarios with large amounts of traces and short debugging windows. It is suitable for online agents, browser agents, customer service agents and automated research agents.
SQL directly to the data layer: Built-in SQL editor and API access make traces, metrics, and events not just stay in UI filters. The mechanism turns observation data into analyzable data. The effect is that datasets can be created in batches from error samples and then used in reverse for eval; it is suitable for R&D and platform teams with existing data analysis capabilities.
Self-hosted path: Docker Compose and production full compose give teams control over the data plane. The effect is to reduce the resistance for sensitive agent data to enter third-party hosting environments; applicable scenarios include internal knowledge base agents, enterprise process agents, and business agents containing customer data.
How to use
The usage entrance of Laminar is divided into three layers: hosting platform, self-hosted deployment and SDK/CLI access. The fastest path given by the official README is to use the managed platform; for self-hosting, you can clone the warehouse and start it through Docker Compose. The lightweight version can be accessed in a local browser by default.
| Usage portal | Typical steps | Suitable objects | Key points for acceptance |
|---|---|---|---|
| Managed platform | Create a project, generate project API key, and connect to SDK | Teams who want to quickly verify traces/evals | Whether the first trace is visible and whether the agent key span is complete |
| Self-host Docker Compose | clone warehouse docker compose up, configure SDK baseUrl and port | R&D team that needs to control the data plane | Service availability, database persistence, upgrade migration, permission boundaries |
| TS / Python SDK | npm add @lmnr-ai/lmnr or pip install lmnr[all], initialize Laminar | Developers with existing agent code | Automatic instrumentation coverage, manual observe annotation cost |
| Evals / CI | Run evals using SDK or CLI, compare results locally or in CI/CD | Teams needing regression evaluation | Evaluation set quality, threshold rules, failed sample recycling |
The minimum pilot can start from an agent workflow with a high failure rate: connect to trace, mark failed samples, convert them into datasets, and then run eval after each prompt, tool or model change. This can verify the core functionality of Laminar, instead of just verifying whether the dashboard in the screenshot looks good.
Product Pricing
The pricing model is subject to the official real-time page. Usually a freemium or subscription system is used, and basic functions can be used for free. Advanced functions or high-frequency use require paid subscriptions, and users are advised to evaluate the optimal solution based on actual usage.
Application scenarios
Laminar is more suitable for scenarios where the agent has entered the engineering stage, especially for systems where the cause of failure is difficult to see clearly from a single log.
- Browser/webpage operation agent debugging: Integration such as Browser Use and Stagehand make it suitable for tracking model judgments, tool calls and page operations in webpage tasks. The core benefit is to locate whether a failure occurred in sensing, planning, tool execution, or output parsing.
- Customer service and internal process agent monitoring: Multi-step customer service, work order diversion, and internal approval agents often involve model calls, business APIs, and rule judgments. Laminar can use signals to track logic errors and dashboards to observe problem trends.
- LLM Application Regression Evaluation: Changes in prompts, model versions, and tool schema can cause behavioral drift. Laminar's evals, datasets, annotation and CI/CD are suitable for settling key samples into continuous regression sets.
- Agent running data analysis: SQL editor allows traces, metrics, and events to be queried and converted into datasets in batches. Suitable for platform teams to analyze time-consuming spans, common failure types, and model cost structures.
Unsuitable scenarios include chat-only demos, one-time prompt word experiments, early prototypes without production traces, and ordinary web services that only require traditional APM.
Applicable people
Laminar's strong adaptability groups are teams that are already building agent applications and need to accumulate debugging experience into reusable observation and evaluation assets.
- AI engineers and agent developers: Need to know which span, which tool, or which model output each agent failure occurs in. Laminar can expand links into traces and supports manual observation to wrap key functions.
- LLMOps/Platform Team: Need to uniformly monitor the running quality of multiple agent projects, build dashboards, query trace data, and manage self-hosted deployments. Laminar's SQL, dashboards, and self-hosted paths align more closely with platform responsibilities.
- QA and evaluation leader: Need to connect manual annotation, failed samples and regression evaluation. Laminar's datasets, annotations, and evals serve the process of "detecting behavioral degradation before going live."
- Product and Business Leader: Suitable for viewing quality trends and failure types in mature teams, but not suitable for using Laminar directly as a no-code business tool.
The prerequisite is that the team has at least basic engineering access capabilities, can maintain SDK/API keys, and can define eval samples and business failure criteria. Without these foundations, Laminar's abilities are used inefficiently.
Summary and Outlook
It provides competitive solutions in its field, and its core value lies in lowering the threshold for AI use in this field.
Current limitations: Some advanced features require paid subscription, and the free version has function or usage restrictions; specific technical details and performance benchmarks have not yet been fully disclosed.
Related tools:  CrewAI,
  LangChain
Version Info
- Laminar v0.2.0 :The latest version published by GitHub Releases includes traces chat, debugger rework, self-hosted Slack OAuth broker, Better Auth migration SQL and tracing related improvements, etc.
- Laminar v0.1.46 :The last public version node in the GitHub tag versus v0.2.0 changelog comparison, used as a direct historical baseline for v0.2.0.
- Laminar v0.1.45 :Historical version nodes publicized by GitHub tags. There is currently no official precise release date. It is suitable for tracing back the evolution of the 0.1.x series.
User Reviews