 Orange Data Mining
Free
Orange Data Mining
Free
Orange is an open source data mining and machine learning platform developed by the University of Ljubljana, Slovenia. It is famous for its color visualization workflow, drag-and-drop analysis pipeline construction, and built-in rich data visualization components and ML algorithms.
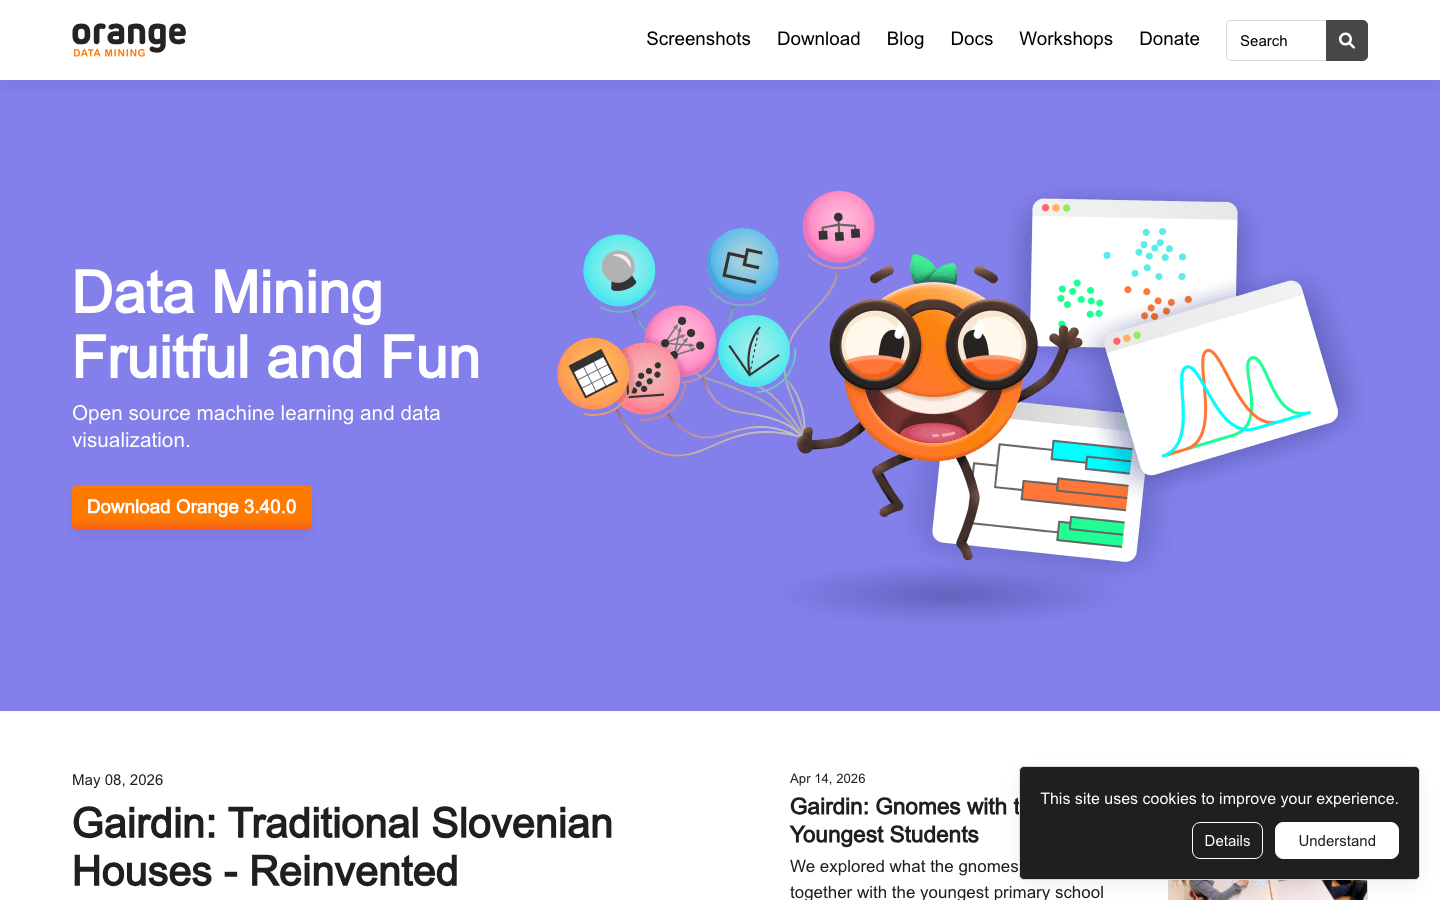
OrangeDataMining
Core parameters and statistics of Orange Data Mining
| Parameter item | Description |
|---|---|
| Product positioning | Open source visual data mining and machine learning platform, complete the complete data analysis process with zero programming |
| Core components | 200+ Widgets (data loading/cleaning/transformation/modeling/evaluation/visualization) |
| Built-in algorithms | Classification, regression, clustering, dimensionality reduction, association rules, anomaly detection, feature engineering |
| Platform support | Windows / macOS / Linux (Python 3.10+), support standalone installer, conda, pip |
| Architecture form | Desktop client (main) + Python script library (Orange Data Mining Library) |
| Open Source License | GPL 3.0 |
| GitHub Community | 5.7k Stars, 1.1k Forks, 106 contributors, 46 Releases |
| Academic citations | 5,000+ academic paper citations (available on Google Scholar) |
| Latest stable version | 3.40.0 (2025-12) |
| Extended Ecology | 12+ official Add-ons (text mining, bioinformatics, time series, image analysis, geospatial, network analysis, etc.) |
| Development language | Python 98.6%, GUI built based on Qt 6 / PyQt6 |
The core parameters of Orange point to a clear positioning: it is not designed for big data production context, but for interactive exploratory analysis and data science education. 200+ Widgets cover the complete link from data loading to model evaluation, but all calculations are completed in local memory - the best experience is when the single-machine data set is within 500MB. Beyond this scale, performance degradation needs to be carefully evaluated.
Users and market recognition of Orange Data Mining
In-depth penetration of academia, industry as a probe tool. Orange was developed by the Bioinformatics Laboratory of the University of Ljubljana in Slovenia in 1996. After nearly 30 years of iteration, it has formed a unique product ecosystem:
- GitHub Community: 5.7k Stars, 1.1k Forks, 106 contributors to the main repository. There is an active Discord community and a dedicated Q&A tag on Stack Exchange. There are dozens of independent warehouses in the Add-ons ecosystem (orange3-text, orange3-bioinformatics, etc.).
- Academic Citations: 5,000+ academic papers cite Orange in the methods section, mainly in the fields of bioinformatics, medical statistics, social sciences, and education and teaching research. Molecular biologist Gad Shaulsky (Baylor College of Medicine) and synchrotron radiation scientist Ferenc Borondics (SOLEIL) have published articles recommending it.
- Teaching Coverage: Hundreds of universities around the world use Orange in introductory data science courses to replace or supplement similar products such as WEKA and RapidMiner. The official provides a special teaching courseware package (Gairdin series), which contains graded lesson plans from primary school to postgraduate level. Francesca Vitali, a researcher at the University of Arizona, conducts monthly Orange workshops.
- Industrial Users: There are few open cases, mainly focused on exploratory data analysis in the fields of biotechnology, pharmaceuticals and chemical industry, rather than core production pipelines.
Market positioning judgment: Orange is not a competitor to Tableau or Alteryx, but an entry-level bridge to zero-programming data science** - it allows researchers and students with non-technical backgrounds to bypass the coding threshold and directly understand the core concepts of data mining. Its irreplaceability lies in "teaching friendliness" rather than "enterprise-level capabilities".
The cost advantage of Orange Data Mining: Open source and free lower the entry barrier for data science
C-side/individual user
| Version form | Price | Description |
|---|---|---|
| Orange Desktop (Standalone Installer) | Free | Windows/macOS/Linux full functionality, offline installation |
| Orange Portable | Free | Installation-free compressed package, ready to use after unzipping, suitable for environments without administrator rights |
| Orange via Conda | Free | conda install orange3, suitable for Python developers |
| Orange via pip | Free | pip install orange3, PyQt6 needs to be pre-installed |
| Orange Web (Experimental) | Free | Online version, no installation required, limited functionality |
| Orange Educational (Gairdin) | Free | Customized version for teaching, including graded courseware package and preset data set |
API / Developer Layer
Orange does not provide commercial API services. Its Python library (the orange3 package) is freely distributed via PyPI and conda-forge. If developers want to embed Orange’s analytical capabilities into their own systems, they have two paths:
- Python Script Widget Integration: Embed custom Python code within visual workflows, calling PyTorch/TensorFlow/scikit-learn or external APIs.
- Orange Data Mining Library direct call:
import Orangein your own Python script, and use itsOrange.data,Orange.classificationand other modules for programmatic data mining.
Both methods are free, but require the team to have Python development capabilities and are not out-of-the-box API solutions.
Enterprise / Privatization Layer
Orange does not offer an enterprise version or commercial support contract. Businesses can take the following paths:
- Self-Hosted Deployment: Completely free, but you need to handle installation, operation and maintenance, training and troubleshooting by yourself.
- Commercial Support Channel: No official SLA or technical inquiries at this time. Community support is the main channel (Discord, Stack Exchange, GitHub Issues).
- Secondary Development: The GPL 3.0 license allows modification and redistribution, but must comply with the terms of the open source agreement (modified versions must also be open source).
Hidden cost analysis
FREE TRUTH:
- Hard cap on computing resources: All widgets run in single machine memory. The official Roadmap explicitly acknowledges that "Orange can currently address data of up to around 500 MB". Interactive operations on data sets with more than one million rows will cause obvious lags, and long-running operations cannot be interrupted and there is no progress bar feedback.
- Missing enterprise-level functions: no user rights management (RBAC), no audit logs, no data version control, and no high-availability deployment solution. Enterprises with strict compliance reviews may need to purchase additional commercial data science platforms.
- Community Support Dependent: The core team runs on research funding and donations. GitHub Issues currently has 102 open issues, and Pull Requests has a backlog of 11. Bug fixing pace is uncertain.
Compare commercial alternatives
| Comparative dimensions | Orange (free and open source) | Tableau Prep ($70/user/month) | Alteryx Designer ($5,195/year) | RapidMiner Studio (free for basic version, $5,000+/year for enterprise version) |
|---|---|---|---|---|
| License Fee | $0 | $840/year/user | $5,195/year | $0 ~ $10,000+/year |
| Deployment method | On-premises installation (offline) | SaaS + on-premises hybrid | On-premises | SaaS + on-premises hybrid |
| Data processing limit | ~500MB RAM | Scalable to GB | Scalable to GB | Depends on memory configuration |
| Interactive visualization | Top (200+ Widgets, click linkage) | Excellent | Moderate | Good |
| Enterprise Security Control | None | RBAC + Audit | RBAC + Audit | RBAC + SSO |
| Commercialization Support | None (Community only) | 24/7 Enterprise Support | Enterprise Support | Enterprise Support |
| Suitability for teaching | Excellent (designed for teaching) | Fair | Poor | Moderate |
For educational institutions and individual learners with limited budgets, Orange's cost advantage decisively outweighs the functional gap. But for production environments where the data volume exceeds 500MB and requires corporate compliance control, investment in commercial tools is necessary - Tableau Prep's return on data throughput and security control at $70 per month far exceeds its subscription fee.
Key features of Orange Data Mining
- Visual Workflow Editor (Visual Programming Canvas): Orange’s core differentiating capability. 200+ Widgets are arranged on the canvas by dragging and connecting to form a data pipeline. The output of each Widget can be previewed in real time, forming a "what you see is what you get" analysis experience. Unlike the workflows of KNIME and RapidMiner, each node in Orange can expand the data preview pane on the canvas without the need for additional pop-up windows.
- Interactive Data Visualization Matrix: 50+ visualization components covering scatter plots, boxplots, heat maps, treemaps MDS, t-SNE, linear projection, parallel coordinate Nomogram, Pythagoras Tree, etc. The core interaction design is "Click-to-Explore" - click on any data point in the chart, and the corresponding original data row will be highlighted simultaneously in all associated widgets, enabling instant drill-down from global statistics to individual samples.
- Machine learning modeling and evaluation package: built-in complete classifiers (random forest SVM, XGBoost, kNN, naive Bayes, logistic regression), regression models (linear regression, ridge regression, regression tree KNN regression), clustering algorithms (K-Means, hierarchical clustering DBSCAN), dimensionality reduction methods (PCA, t-SNE, MDS). After training is completed, you can drag in Confusion Matrix, ROC Analysis, Test & Score, Calibration Plot and other evaluation widgets to complete the closed comparison. You can compare multi-model AUC, F1, Precision/Recall and other indicators without programming.
- Visualization of the entire text mining process (orange3-text): From corpus loading → preprocessing (word segmentation, filtering stop words, stemming) → word frequency statistics → topic modeling (LDA) → sentiment analysis → word cloud visualization, the entire text analysis process is completed through drag and drop. Supports multilingual text preprocessing such as Chinese, and has built-in multilingual word segmenters.
- Image analysis pipeline (orange3-imageanalytics): Load images in batches from image folders, automatically extract color histogram SIFT features and deep learning features (based on pre-trained CNN) for image clustering, classification and similarity retrieval. Suitable
Rapid exploration of small-scale image datasets, but not for production-grade computer vision scenarios.
- Python Script Extension Node: The Python Script Widget allows users to embed custom Python code in visual workflows, access data in the current workflow context (
in_data), call third-party libraries such as PyTorch / TensorFlow / scikit-learn, or integrate with external systems through HTTP APIs. This transforms Orange from a closed visualization tool into an extensible data science sandbox. - Add-ons ecological extension: Official maintenance of 12+ Add-ons, including Bioinformatics (gene expression, pathway enrichment), Text (text mining), Time Series (time series prediction), Network (social network analysis), Geo (geographical visualization), Explain (LIME/SHAP model explanation), Associate (association rules), Educational (Gairdin teaching game), Single Cell (single cell data analysis), Spectroscopy (spectroscopy analysis), etc. One-click installation through Options → Add-ons menu, each Add-on adds 5-20 dedicated Widgets.
Expert View: The real value of Orange is not in the capabilities of a single Widget, but in the cooperative linkage mechanism between Widgets. For example: After loading CSV from File Widget, connect to Scatter Plot visualization, select outliers → Data Table automatically displays detailed data of the selected row → Feature Statistics synchronizes updating of statistical summary → Save Data exports the cleaned subset. The entire process is a real-time interaction of "selection → feedback → iteration", rather than a batch-style serial execution. This design greatly reduces the cognitive friction in exploratory data analysis - users do not need to manually switch contexts between data cleaning, visualization, and modeling, and all analysis steps remain synchronized on a unified canvas.
Model and version evolution of Orange Data Mining
Orange's version lineage spans nearly 30 years, from Python 1.5.2 prototypes in 1996 to today's modern desktop applications with Qt 6. The following are the key nodes of the mainline version:
Mainline release
| Version | Date | Core Changes |
|---|---|---|
| 3.40.0 | 2025-12 | The latest stable version. PyQt6 migration completed, icon system modernized, performance optimized |
| 3.39.0 | ~2025-09 | Geo Map enhancement, time series Add-on update OWWidget base class reconstruction |
| 3.38.0 | ~2025-03 | Enhanced neural network visual training component and improved model interpretive tool (Explain Add-on) |
| 3.37.0 | ~2024-12 | AI-driven automatic data cleaning suggestions, text mining module enhanced Python script node performance optimization |
| 3.36.0 | ~2024-06 | Geo Map geographical visualization component, time series analysis enhancement, CNN-based image feature extraction |
| 3.35.0 | ~2024-03 | Neural network visualization training component, text classification enhancement, model interpretability tool (LIME/SHAP integration) |
| 3.34.0 | ~2023-10 | Data sampling Widget improvement, feature engineering enhancement, performance optimization |
| 3.33.0 | ~2023-06 | Classification calibration curve Rank projection, data analysis report export |
| 3.26.0 | 2020-06 | Python 2 supports termination of migration, new Widget toolbox classification system |
| 3.0.0 | ~2015 | Orange 3 major refactoring, moving from C++/Python hybrid architecture to pure Python 3 + Qt |
Version evolution trend analysis
- Technical debt cleanup period (2023-2025): Versions 3.33~3.40 focus on PyQt6 migration, database backend reconstruction, CI/CD modernization and icon system renovation. These changes have limited functionality gains for end users, but are critical to the long-term health of the project.
- Feature innovation slows down: Compared with the pace of 3-4 minor versions per year from 2015 to 2020, it has dropped to 2 versions per year in recent years. Indicates that the project has entered a stable maintenance period, and new features are more delivered through Add-ons.
- Add-ons become the battleground for innovation: New algorithms and domain-specific capabilities (single-cell analysis, geospatial, model interpretability) are more delivered through Add-ons, with core Orange projects focused on canvas stability and infrastructure.
- Excessive jump in version number: There are 14 minor versions from 3.26.0 (2020-06) to 3.40.0 (2025-12), with an average of one version every 4.7 months. The rhythm is reasonable but not as fast as the iteration speed of commercial products such as RapidMiner.
Technical advantages of Orange Data Mining
The following explains Orange's engineering selection through the "mechanism → effect → scene" causal chain:
1. DAG-based Widget execution engine
- Mechanism: Orange uses Directed Graph (DAG) as the workflow execution model. Each Widget is an independent Python process instance that communicates through the signal-slot (Signal-Slot) mechanism. When the upstream Widget output is updated, the downstream Widget automatically receives the signal and incrementally recalculates it, rather than refreshing it in full.
- Effect: After the user modifies the data cleaning parameters (such as missing value filling strategy), subsequent charts, statistics and model results are automatically updated synchronously within hundreds of milliseconds, realizing the interactive experience of "Edit → Instant Feedback". This is in sharp contrast to the manual cell-by-cell rerun of Jupyter Notebook.
- Applicable scenarios: The data exploration stage (feature selection, outlier processing, cluster number determination) that requires repeated parameter adjustment requires 60-80% fewer steps than the Notebook workflow.
2. Selection Mask Propagation
- Mechanism: Orange transfers not only the data table but also the selection mask between Widgets. When the user selects a data point in the Scatter Plot, the selection status is broadcast as an auxiliary signal to all downstream widgets, which highlight or filter the corresponding data rows accordingly. This mechanism is implemented in Orange's underlying channel (
SignalManager) and is transparent to Widget developers. - Effect: Three-dimensional synchronous linkage from visualization to data tables to statistical summaries shortens the single cycle of "discovering anomalies → locating causes → verifying hypotheses" from 3-5 minutes to 10-20 seconds.
- Applicable scenarios: outlier analysis, clustering result verification, root cause analysis of misclassified samples, multi-view data cross-validation.
3. Widget component architecture (OWWidget base class system)
- Mechanism: Each Widget inherits from the
OWWidgetbase class and defines data ports through declarativeInputs/Outputs. The architectural design refers to the Unix pipeline philosophy - each component does one thing and does it well, and is freely combined through standardized interfaces. To contribute a new Widget from the community, you only need to implement a Python class to define input, output and GUI layout. - Effect: Lowering the community contribution threshold is the fundamental reason why Orange can accumulate 200+ Widgets. Any Python developer can develop and publish a dedicated widget in days.
- Applicable scenarios: Research teams that need domain-specific analysis components (such as spectroscopy, metabolomics) can quickly build their own widgets and incorporate them into their own workflows.
4. Qt 6 cross-platform GUI and background thread isolation
- Mechanism: Orange 3.40 completes the migration from PyQt5 to PyQt6 and unifies the three-terminal rendering behavior. The GUI layer and the computing layer are isolated through
QThread/QProgressDialog, and computing-intensive operations are executed in the background thread without blocking interface events. - Effect: The cross-platform user experience is consistent, and the Retina high-resolution screen and native menu bar are supported under macOS.
- Limitations: Background thread isolation is not complete - when a single data set exceeds 500MB or the integrated algorithm is too computationally intensive, the interaction between the Python GIL and the Qt main thread will still cause perceptible UI lag. This is an inherent limitation of the CPython + Qt architecture.
5. Double-layer design of Orange Data Mining Library
- Mechanism: Orange provides two sets of APIs - the high-level visual Widget API (oriented to drag-and-drop workflow) and the underlying Python library API (
Orange.data,Orange.classification,Orange.preprocessand other modules). The underlying library can be imported and used directly in Python scripts and shares the same computing core with the high-level canvas. - Effect: Users can smoothly switch between "drag and drop prototype verification" and "coding refinement" without migrating data between different tool ecosystems.
- Applicable scenarios: The enterprise data team first uses Orange Canvas for exploratory analysis, and then uses Python scripts to call the same underlying library to complete the coding implementation of the production-level pipeline.
How to use Orange Data Mining
Installation entry control
| Channels | Commands/Operations | Applicable people |
|---|---|---|
| Windows Standalone | Download .exe from the official website, double-click to install |
Beginners with zero programming experience |
| Windows Portable | Download .zip, unzip and use |
Enterprise context without administrator rights |
| macOS (Apple Silicon) | Download arm64.dmg and drag it into Applications |
M1/M2/M3 Mac users |
| macOS (Intel) | Download x86_64.dmg and drag it into Applications |
Intel Mac users |
| Conda (recommended) | conda install orange3 |
Python developers / teams that have used conda |
| pip | pip install orange3 (PyQt6 needs to be installed first) |
Python users who are familiar with pip |
| winget (Windows) | winget install --id UniversityofLjubljana.Orange |
Windows Package Manager users |
| Source code compilation | git clone && pip install -e . |
Contributors / Developers who need customization |
Typical usage steps
- Start Orange: Run
python -m Orange.canvasfrom the command line, or double-click the desktop icon. It takes about 10-30 seconds to load the Widget directory on first startup. You can skip the welcome screen by running--no-splash --no-welcome. - Load data: Drag the File Widget from the Data category and select the local CSV/Excel (
.xlsx)/TSV file. Orange automatically infers column types (numeric/categorical/text/time) and users can preview the original records in the Data Table Widget. - Data Cleaning and Exploration: Drag in the Select Columns (select/sort columns), Select Rows (filter rows by conditions), Impute (process missing values), and Outliers (outlier detection) widgets. Visualize data distribution and statistical summaries with widgets such as Box Plot, Scatter Plot, Feature Statistics, and more.
- Modeling Training: Select an algorithm Widget (such as Random Forest, Logistic Regression, SVM) from the Model classification and connect to the Data signal source. Drag into the Test & Score Widget to evaluate the model using cross-validation, and the results automatically include indicators such as AUC, F1, Precision, Recall, and CA.
- Model Explain: Connect the SHAP/LIME Widget of the Explain Add-on to visualize feature importance rankings and individual prediction explanations. Or use the Nomogram Widget to draw a logistic regression nomogram.
- Result visualization and export: Use widgets such as ROC Analysis, Confusion Matrix, Calibration Plot, etc. to complete the evaluation. Export the cleaned dataset to CSV via the Save Data Widget, or serialize the model to a
.pkclsfile via the Save Model Widget. - Workflow Saving and Sharing: Save the entire workflow in
.owsformat, which can be opened and shared across platforms.
Notes
- Add-ons installation: Main menu Options → Add-ons, check the required expansion pack and restart Orange. Download timeout may occur under domestic network conditions. It is recommended to download the
.whlfile or configure the proxy in advance. - Data format compatibility: Native support for CSV, Excel, TSV. SPSS
.savfiles can be read through pandas and imported into the Python Script Widget. Direct JDBC/ODBC database connections are not supported. - Python Script Widget uses:
in_datavariable to get input data,out_data = ...to set output. Any installed third-party Python library can be used. Note that script errors will not block the canvas, but will display error messages in the Widget interface. - Debug Assist: Run with
python -m Orange.canvas -l 2to output more detailed log information, and-l 4to provide higher level debugging output.
Product Pricing for Orange Data Mining
Orange is completely free and open source and follows the GPL 3.0 license. There are no hidden charges, feature lock-ins or subscription tiers.
| Version form | Price | Function restrictions | Suitable scenarios |
|---|---|---|---|
| Orange Desktop (Standalone) | $0 | None | Personal learning, teaching, scientific research and exploration |
| Orange via Conda/pip | $0 | None | Developer integration, automation scripts |
| Orange Add-ons (Official 12+) | $0 | None | Special analysis of text/biological information/time series, etc. |
| Orange Web (Experimental) | $0 | Limited functionality, incomplete components | Quick demo, no installation required |
| Orange Educational (Gairdin) | $0 | Simplifying teaching for K-12 | Computer science education in primary and secondary schools |
The free truth: Orange's "free" is truly full-featured free open source, without the functional emasculation of the RapidMiner Studio basic version that limits the number of data rows (10,000 rows) or model types. But enterprise users should note: Free tools ≠ zero total cost of ownership - lack of enterprise support means that internal manpower needs to be invested in maintenance and training. This hidden expense may exceed the annual subscription cost of commercial tools in teams of more than 50 people. In addition, the GPL 3.0 license requires that distribution of modified versions must be open source, and legal compliance teams need to evaluate whether this clause conflicts with corporate software policies.
Application scenarios of Orange Data Mining
- Introduction to Data Science Teaching (Dimensionality Reduction Strike Scenario): When teachers teach K-Means clustering or decision tree bifurcation in class, students use Orange to drag components, adjust K values, and instantly observe changes in clustering results or decision boundaries, transforming abstract algorithms into intuitive visual feedback. According to feedback from the education community, students' understanding of PCA and t-SNE has been significantly improved in classes using Orange compared to purely theoretical classes - because students can directly drag and drop to adjust the perplexity parameters and observe changes in the projection results in real time. Key points to check: Whether students can independently complete the complete workflow from CSV loading to classifier evaluation.
- Bioinformatics Exploratory Analysis: Gene expression data usually have "high-dimensional, small sample" characteristics (thousands of genes, dozens of samples), Orange's Heatmap clustering PCA projection and Enrichment Analysis (through Bioinformatics Add-on) are just suitable for pattern discovery in this type of data. Molecular biologists can complete the complete process from data loading to pathway enrichment analysis with zero programming. Verification focus: The coverage of bioinformatics methods in Add-on - whether it includes key functions such as GO enrichment analysis and KEGG pathway mapping.
- Text Classification and Sentiment Analysis Prototype Verification: Market research analysts export review text from social media or questionnaires, and use Orange Text Add-on to complete the complete prototype of word segmentation→word frequency statistics→LDA topic modeling→sentiment classification in 30 minutes, which is about 3-5 times faster than Python coding implementation. Verification focus: The accuracy of Chinese word segmentation and dictionary scalability; whether the output results are intuitive and can be directly used in reports.
- Data quality audit and preprocessing: Before transferring the data to the formal BI system or ML pipeline, use Orange to quickly complete data exploration - missing value distribution, outlier detection, correlation matrix, feature distribution statistics. Orange's interactive visualizations make data quality issues clear at a glance, which is easier than writing pandas one by one
The command is efficient. Key points to verify: Whether dirty data patterns (duplicate rows, inconsistent formats, outliers) can be automatically detected and marked, and whether cleaning rules can be saved and reused.
- Cross-position data analysis collaboration: After the business analyst (non-technical background) completes the preliminary analysis with Orange, he sends the
.owsworkflow file to the data scientist colleague, who uses the Python Script Widget to inject more complex statistical models or custom algorithms into the existing workflow to avoid connecting data and business logic from scratch. Verification focus: Cross-platform compatibility and version compatibility of workflow files.
Applicable groups of Orange Data Mining
- Data Science Beginners/Career Changers: Learners who are intimidated by programming but need to master the basic concepts of data analysis. Orange's drag-and-drop operation eliminates grammatical barriers and allows learners to focus on algorithm principles and data analysis thinking. Recommended path: First use Orange to complete 20 workflow projects to understand the core concepts, and then transition to Python + scikit-learn for coding practice. Not suitable for the boundary: If the goal is to become a professional data engineer, Orange is only suitable as an introductory tool for 2-4 weeks and should not be relied on for a long time.
- College Teachers/Training Instructors: Teaching workers who need to vividly demonstrate data mining concepts. Orange’s interactive visualizations (especially the ability to click on a data point to instantly highlight associated information) are a teaching tool that cannot be replaced by static PPT screenshots. The Gairdin teaching series (including graded courseware from primary school to postgraduate level) is officially provided, and teachers can use it directly or adapt it twice. Prerequisite: Teachers need to spend 4-8 hours to be familiar with the Widget directory and workflow setup.
- Scientific researchers (biology, medicine, social sciences): Researchers who have data analysis needs but lack professional programming training. Orange allows researchers to complete data exploration and preliminary modeling independently, reducing dependence on laboratory data scientists. Unfit Boundary: When GWAS analysis of millions of samples or large-scale RNA-seq data processing is involved, you need to migrate to R/Bioconductor or Python dedicated libraries.
- Business Analyst/Market Researcher: Analysts who need to quickly validate data assumptions and create exploratory charts. Orange can go from CSV load to release-grade scatter/boxplot output in under 5 minutes. Prerequisite: You need to ensure data quality by yourself (Orange does not provide enterprise-level data governance capabilities). Not suitable for boundaries: When you need to produce fixed-format periodic reports, Tableau / Power BI is a more suitable choice.
- **Enterprise Data Team
(Prototype verification stage): Before writing the formal pipeline, data scientists first use Orange drag and drop to verify the feasibility of the analysis idea. Empirical deductions show that this section can shorten the early exploration time by 60-80%. Not suitable for boundaries**: Orange's workflow is not suitable for direct export to production-grade code. Conversion from prototype to production still requires manual coding or pipeline refactoring using MLOps tools (such as MLflow, Kubeflow).
Summary and Outlook
Core Competencies: Orange redefines data analysis as a "visual design" process - drag and drop, connect, click to explore, and instant feedback. The component library of 200+ Widgets, the selection state linkage mechanism between Widgets, and zero programming threshold make it occupy a unique position in the data science education market and scientific research and exploration fields. The quality of its interactive visualization is at the top level among similar open source tools, especially in the implementation of interactive paradigms such as "click-to-drill" and "multi-dimensional linkage", and is even better than some commercial products. As an open source project that has been continuously iterating for nearly 30 years, Orange has accumulated deep recognition from the academic community and a teaching resource ecosystem.
Current Limitations:
- Clear computing boundaries: The upper limit of single-machine memory is about 500MB, which is not suitable for enterprise-level big data processing. The development team Roadmap has listed "scalability" as the primary improvement direction, but as of now there is no specific timetable and architectural plan.
- Weak production deployment capabilities: No server-side deployment solution, no REST API, no concurrent processing mechanism, and no Docker containerization support. Production context use requires cooperation with external scheduling systems (such as Apache Airflow) and custom Python script bridging.
- Maintenance Resource Uncertainty: The core team relies on research funding and community donations to sustain development. The Roadmap document frankly states that "We need to address funding. The development of Orange relies on a core team sponsored by research and development grants." The pace of bug fixes and feature iterations is affected by funding fluctuations.
- Incomplete deep learning integration: Although PyTorch / TensorFlow can be called through the Python Script Widget, it lacks native support for GPU acceleration, specialized deep learning workflow templates, and visual monitoring of the model training process.
- Lack of team collaboration capabilities: No workflow version history, no comment/annotation function, no collaborative editing. Multi-person collaboration scenarios need to rely on external version control (Git) to manually manage
.owsfiles.
Procurement/Adoption Risk Assessment: Educational institutions and individual learners can adopt Orange without hesitation - it’s completely free, has rich teaching resources, and has an active community. Enterprise teams need to evaluate three key issues before introduction: ① Whether the data size is within 500MB of a single machine; ② Whether enterprise control functions such as user rights management and audit logs are required; ③ Whether the team has the ability to solve usage problems on its own without commercial support. If the answer to any of the questions is "yes", it is recommended to limit Orange to the prototype verification and exploratory analysis stage, and still use commercial platforms such as Alteryx/Tableau Prep or self-built solutions based on Python/PySpark for the production pipeline. The long-term availability of Orange is highly dependent on the R&D budget of the University of Ljubljana and the health of the open source community. When enterprises adopt it, it is recommended to monitor the commit activity and issue response speed of the GitHub warehouse every quarter, so as to formulate a migration plan in a timely manner when community activity declines.
Version Info
- Orange 3.37 :Added AI-driven automatic data cleaning suggestions, enhanced text mining module, and performance optimization of Python script nodes.
- Orange 3.36 :Introducing Geo Map geographical visualization components, time series analysis enhancements, and feature extraction functions based on image models.
- Orange 3.35 :New neural network visualization training components, text classification enhancements, and model interpretability tools have been added.
User Reviews